This article contains the significance of market risk in the insurance industry and the necessity of risk management in this area. Our goal is to improve the methods which are established by insurance supervision using the integrated Value-at-Risk (VaR) model as a new tool for evaluating the market risks of insurance companies in Kazakhstan. Based on mathematical statistics the calculations of various VaR approaches were studied in detail, and provided a comparative analysis of VaR methods and suggestions for some types of companies by these particular approaches.
One of the disadvantages of risk management in insurance area in Kazakhstan is the lack of the optimized methods of controlling risks as well as actions to minimize risk factors and the extent of possible damage. Incompleteness of historical data of insurance companies is the main drawback of non-usage of estimation methods for evaluating risks. Therefore, the models are based on a huge number of assumptions, which does not reduce the risks of the insurance sector.
The insurance industry includes many types of risks: risks associated with insurance activities; investment risk: credit risk, liquidity risk, market risk; operational risk and other associated risks.
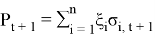
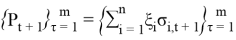
The International Association of Insurance Supervisors (IAIS) assessed the exposure of insurance companies to the following risks in Figure 1. It is seen that insurance companies have greater exposure to market risks that are the risks of losses due to unforeseen changes in prices in the market.
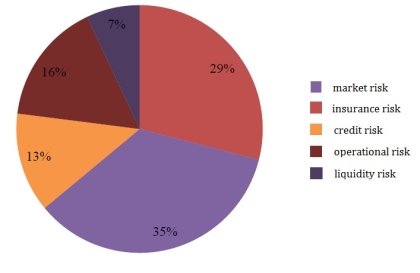
Fig. 1. Statistics of IAIS for 2018 year
Market risk happens as the result of unpredictable turn of events such as fluctuations in the prices of traded assets, exchanging rates and commodities which bring to a change in the value of financial instruments. For insurance companies as well as for others, it is crucial to be prepared for all changes that may happen suddenly and correctly identify the market risk.
Stress testing procedures allows to estimate the maximum expected losses for probable events that do not directly fit into current economic trends and therefore are poorly predictable. We suggest considering internal VaR models as a necessary complement to the use of stress testing to calculate market risk, without denying the power of stress testing in assessing other types of risks.
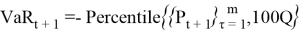
Value-at Risk (VaR). The definition of VaR is “The worst potential loss over a given horizon of time with a level of target probability”.
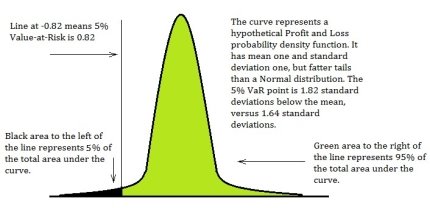
Fig. 2. Graphical representation of VaR
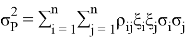
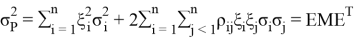
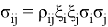
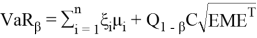
The value of VaR is a function of two parameters: the confidence level β (or significance level 1- β ) and the risk horizon, denoted t , which is the period of time.
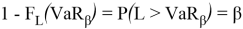
The mathematical definition of VaR can be defined as a quantile of a return distribution function over a given time horizon


where,


with

where,


There exist three approaches of VaR: Historical Simulation; Delta Normal method and Monte Carlo Simulation.
Historical Simulation.
In historical modeling, data is taken from the values of financial fluctuations for the portfolio that are already known from the past measurements. Assuming that the next day behavior of portfolio will act approximately in the same as on one of the previous days. Thus, we get 100 outcomes for the next day. Further, we assume that the random variable is distributed normally hence, the result is that VaR is one of the percentiles of the normal distribution. Depending on what confidence level of risk we have taken, we choose the appropriate percentile and, finally, we get the value that interests us. Return of the portfolio for

where,


Forecasting of future returns are based on m daily returns, which have today’s portfolio weights. So, the above (4) formula can be rewritten in the following form:
This method assumes that the distribution of the future returns


Delta Normal Method. The delta-normal method uses the assumption of a multidimensional normal distribution of returns of market risk factors on which the cost of more complex tools, positions and assets in whole depends. In the normal distribution of returns of risk factors, the distribution of returns of instruments assets, which are a linear combination of risk factor returns, also has normal distribution.
It used the same algorithm as Historical Simulation and it is enough to find parameters as


where,


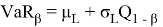
The VaR of the portfolio with the time horizon and the confidence level


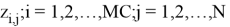
Monte Carlo Simulation. The Monte Carlo simulation involves large number of trials. As a result of these tests, a distribution of possible financial results will be obtained. Monte Carlo VaR estimation is almost always done using software these models may not have formulas, but rather complex programs. So, the Monte Carlo method allows the use of models of virtually any complexity in calculating risks.
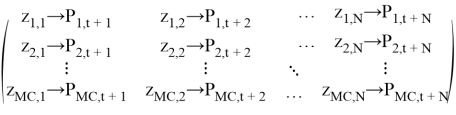
Using random number generators, which are standard in most quantitative software packages, we can generate a set of artificial random numbers


From random numbers set of returns can be calculated for tomorrow as:
So, its model is:
From these hypothetical future daily returns, we can easily calculate the hypothetical N-day return from each Monte Carlo path as:
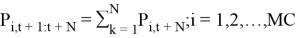

Table 1
Comparative table of three methods by different characteristics
|
The criteria |
Approaches | ||
|
Historical Simulation |
Delta-Normal method |
Monte-Carlo Simulation | |
|
Valuation type |
Full |
Linear |
Full |
|
Applicability to nonlinear tools |
Yes |
No |
Yes |
|
Accounting of historical distribution |
Using exact data |
Assuming the distribution as normal |
Using the distribution to define some parameters as μ and σ |
|
Assumption about the normal distributed of returns |
No |
Yes |
No |
|
The volume of historical data |
Large |
Middle |
Small |
|
The level of complexity of the computation |
Middle |
Easy |
Small |
The result of the survey which is hold in the Britain’s Financial Services Authority in 2018 showed that in Britain’s banks, Delta-normal method is applied by 42 %, Historical Simulation is used by 31 % and eventually, Monte Carlo Simulation is provided by 23 %. Overall, there are some suggestions:
1) If company has enough retrospective data it's better to use Historical Simulation (m is between 250 and 1000).
2) If company is prosperous and big enough, then Monte Carlo simulation copes with complexity and cost of this method.
3) If the company is small with low liquidity capital, then we suggest Delta Normal method.
References:
- Carol Alexander. Market Risk Analysis Vol. IV. Value-At-Risk Models. John Wiley Sons Ltd., 2008.
- I. I. Drobysh. Var models in estimation of market risk. March 10, 2015.
- I. V. Dyomkin. Estimation of integrated innovative risk, based on methodology value at risk. 3(10):362–378, 2006.
- Schweser Kaplan.FRM Exam Prep Valuation and Risk Models. Kaplan, Inc.,2018.
- Rajesh Kondapaneni. A study of the delta normal method of measuring var.May 5, 2005.
- K. Mynbayev. Value at risk and its calculation for a normal distribution. https://raisingthebar.nl.
- Ministry of Justice of the Republic of Kazakhstan. On approval of the rules for the formation of the risk management and internal control system for insurance (reinsurance) organizations. http://adilet.zan.kz/eng/docs/V1800017462.
- Christoffersen Peter. Elements of Financial Risk Management. AcademicPress, 2003.
- Grebenik V. V. Redkina A. A. Features of risk management in insurance companies. InSoft computing in artificial intelligence, page 3(10). The Eurasian Scientific Journal, 2018.

