The year 2023 marked an unprecedented surge in mortgage lending, setting historic records for the volume of residential mortgage loans issued. The construction sector has never experienced such a wide array of mortgage lending programs in its history. Activity in the Residential Mortgage Lending (RML) market escalated significantly, driven by state-backed credit programs and multiple preferential lending mechanisms. This article provides a retrospective analysis and evaluates the relationship between the growth of household prosperity and the accumulation of mortgage-related debt. Additionally, it investigates the dynamics of mortgage rate adjustments and the volume of loans issued in correlation with fluctuations in real estate prices and changes to the Central Bank of Russia’s key interest rate.
Keywords : construction industry, residential mortgage lending.
В 2023 году наблюдался бум ипотечного кредитования, побив все возможные рекорды по выдаче ипотечных жилищных кредитов. За всю историю строительной отрасли не наблюдалось столько разнообразных программ ипотечного кредитования. Активность на рынке ИЖК росла за счет кредитования по программам господдержки и множества льготных программ. В статье будет рассмотрена ретроспектива и сопоставление роста благополучия населения с его закредитованностью в ипотечном продукте. А также будет рассмотрена динамика изменения ипотечных ставок и объем выданных кредитов в зависимости от изменения цен на недвижимость и изменений ключевой ставки Банка России.
Ключевые слова: строительная отрасль, ипотечное жилищное кредитование.
In 2023, the residential mortgage lending market experienced an unprecedented surge, shattering all-time records for the volume of residential mortgage loans (RML) issued. Credit institutions issued 2.0 million RMLs totaling 7.8 trillion RUB, representing an increase of over 1.5 times compared to 2022 figures. Throughout the history of the construction industry, there has never been such a diverse array of mortgage lending programs. Activity in the RML market was fueled by state-backed credit programs and numerous preferential lending mechanisms, including:
— Family Mortgage;
— IT Sector Employee Mortgage;
— Developer-subsidized mortgage rates.
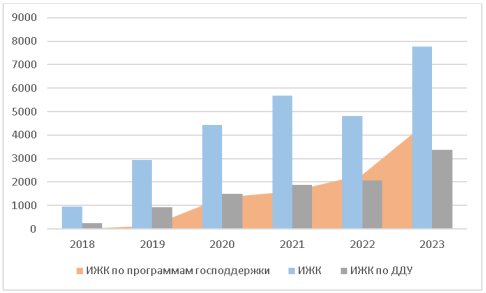
Fig. 1. Dynamics of Residential Mortgage Loan (RML) Volume in RUB, Including RMLs Under Equity Participation Agreements (EPAs), Billions of Rubles
According to data from the Central Bank of Russia (CBR) [18], state-backed residential mortgage loan (RML) issuances reached peak values in December 2023, rising to RUB 657.9 billion (representing 83.8 % of total RML issuance), compared to RUB 542.9 billion (74.8 %) the previous month. While December typically sees increased real estate sales, this exceptional growth was partially driven by borrowers rushing to secure state-subsidized mortgages before the tightening of preferential state program conditions implemented in 2024.
Consequently, 2023 set a record for state-backed RML issuance: RUB 4.7 trillion in preferential loans were issued (up from RUB 2.3 trillion in 2022), accounting for over half (60.8 %) of total RML volume.
The total volume of RUB-denominated loans issued to individuals in 2023 reached RUB 26.1 trillion — a 45.5 % increase from 2022 and 26.4 % higher than 2021. The share of RMLs within total individual lending rose to 29.8 % in 2023 (up from 26.8 % in 2022).
This trend is natural, as the construction sector is a driver of the national economy [19]. As an economic activity, construction contributes significantly to the country’s GDP (approximately 13 %). About 16 % of the workforce is employed in construction, making the sector’s performance a direct factor in economic stability. As noted by Deputy Prime Minister M. Khusnullin during a joint meeting of the State Council Commission on «Construction, Housing and Utilities, and Urban Environment», the construction industry has demonstrated steady growth in recent years, expanding by 24 % between 2021 and 2023, with 103 million square meters of housing commissioned. The critical role of state-supported mortgage lending in stimulating construction development cannot be overstated, as RMLs generate sustainable demand for real estate and address vital social objectives like improving population living standards.
However, 2024 saw reduced demand for mortgage products due to rising market interest rates and the discontinuation of the non-targeted preferential mortgage program. As a result, only 1.3 million RMLs worth RUB 4.9 trillion were issued in 2024 — a decrease of over 1.5 times compared to 2023 and comparable to 2022 levels.
This article provides a retrospective analysis of residential mortgage lending development in Russia from 2000 to the present. The following indicators will be examined:
- Average monthly wages of employees;
- Residential mortgage loan data issued by credit institutions to individuals:
— Number of loans issued;
— Volume of loans issued;
— Average loan size;
— Outstanding loan debt;
— Weighted average interest rate.
- Central Bank of Russia (CBR) key rate;
- Real estate price dynamics and cost per square meter;
- Construction cost per square meter of total floor area;
- Risks of subsidized mortgage programs.
Thus, the article will analyze the retrospective relationship between population prosperity growth and mortgage-related debt burden. It will also examine the dynamics of mortgage interest rates and loan issuance volumes relative to fluctuations in real estate prices, construction costs, and changes in the CBR's key rate.
The analysis will cover:
— Average monthly accrued wages of employees across all organizations;
— Wages of hired workers in organizations, individual entrepreneurs, and private individuals;
— Changes in real average monthly accrued wages.
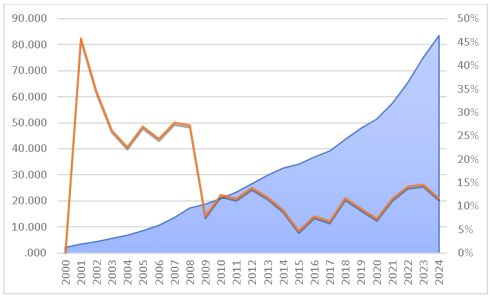
Fig. 2. Average Monthly Nominal Accrued Wages of Employees Across All Organizations (RUB) [20]
As evidenced by the graph, the average monthly nominal accrued wages of employees across all organizations demonstrated steady growth from 2000 to 2024, with a cumulative increase exceeding 3,000 % over the period. However, annual growth rates varied significantly:
— The highest growth occurred between 2001–2008, averaging 29 % annually.
— Peak surges were observed in 2001 (46 %) and 2002 (35 %), with consistent annual growth of ~26 % through 2008.
— Following the 2008 crisis, growth plummeted to 8 %.
— During 2009–2014, wages increased at an average annual rate of 12 %.
— A slowdown persisted from 2014 to 2017, averaging 7 % annually.
— Modest recovery emerged through 2022 (average 11 %), though growth dipped to 7 % (2019) and 5 % (2020).
— Volatility marked 2023–2024: a surge to 15 % (2023) followed by a drop to 12 % (2024).
Regarding average monthly accrued wages of hired workers in organizations, individual entrepreneurs, and private households (data available for 2015–2022):
— Wages rose 65 % in absolute terms over the period.
— Average annual growth stood at 7 %, peaking at 10 % in 2018 and 2022.
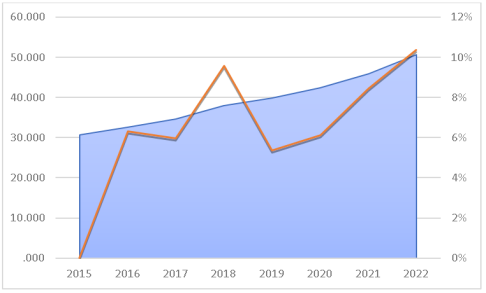
Fig. 3. Average Monthly Accrued Wages of Hired Workers (RUB) в организациях, у индивидуальных предпринимателей и физических лиц [21]
Let us examine real average monthly accrued wages. As seen from the graph below, negative growth was recorded in 2009 (-3 %) and 2015 (-9 %). The average annual growth rate over the entire period was 7.3 %. Peak growth occurred during 2000–2002 and in 2007, with values reaching 20.9 %, 19.9 %, 16.2 %, and 17.2 %.
From 2019 through 2022, the average growth rate declined to 3.4 % annually, with a marginal increase of just 0.3 % in 2022.
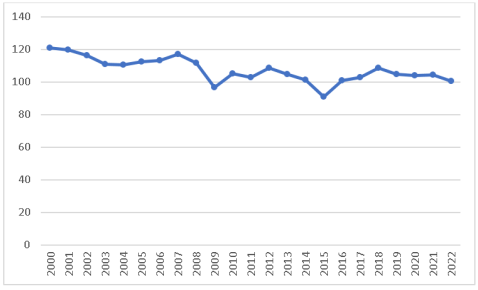
Fig. 4. Real Average Monthly Accrued Wages, % Year-on-Year Change [22]
The growth in real household incomes during the 2000–2008 period was primarily attributable to post-1998 default economic recovery and rising oil prices. Subsequently, beginning in 2014, events including sanctions, the COVID-19 pandemic, and related factors led to a prolonged stagnation of real household incomes.
We now examine data on residential mortgage loans (RMLs) issued by credit institutions to individuals.
Table 1
Residential Mortgage Loan (RML) Data Issued by Credit Institutions to Individuals
|
Дата |
Количество выданных кредитов, ед. |
Объем выданных кредитов, млн руб. |
Средний размер кредита, тыс. руб. |
Задолженность по выданным кредитам, млн руб. |
Средневзвешенная ставка, % |
Средневзвешенный срок кредитования, месяцев |
|
01.01.2006 |
X |
30 918 |
X |
22 223 |
X |
X |
|
01.01.2007 |
X |
179 612 |
X |
144 806 |
X |
X |
|
01.01.2008 |
X |
438 145 |
X |
446 291 |
X |
X |
|
01.01.2009 |
332 041 |
560 671 |
1 689 |
838 942 |
X |
X |
|
01.01.2010 |
128 004 |
142 968 |
1 117 |
812 775 |
13,72 |
X |
|
01.01.2011 |
298 213 |
364 634 |
1 223 |
949 247 |
12,45 |
X |
|
01.01.2012 |
520 658 |
697 417 |
1 339 |
1 314 331 |
11,63 |
X |
|
01.01.2013 |
690 050 |
1 017 316 |
1 474 |
1 874 345 |
12,67 |
X |
|
01.01.2014 |
823 175 |
1 338 731 |
1 626 |
2 536 869 |
12,12 |
X |
|
01.01.2015 |
1 012 064 |
1 753 294 |
1 732 |
3 391 888 |
13,17 |
X |
|
01.01.2016 |
699 419 |
1 157 760 |
1 655 |
3 851 153 |
12,92 |
X |
|
01.01.2017 |
856 521 |
1 472 380 |
1 719 |
4 422 239 |
11,54 |
X |
|
01.01.2018 |
1 086 940 |
2 021 402 |
1 860 |
5 144 935 |
9,79 |
187,6 |
|
01.01.2019 |
1 471 809 |
3 012 702 |
2 047 |
6 376 845 |
9,66 |
200,1 |
|
01.01.2020 |
1 311 959 |
2 934 232 |
2 237 |
7 615 264 |
9,05 |
215,1 |
|
01.01.2021 |
1 780 490 |
4 444 328 |
2 496 |
9 274 486 |
7,36 |
225,1 |
|
01.01.2022 |
1 908 532 |
5 695 075 |
2 984 |
11 752 902 |
7,81 |
257,1 |
|
01.01.2023 |
1 327 289 |
4 813 268 |
3 626 |
13 838 288 |
6,65 |
289,4 |
|
01.01.2024 |
2 212 311 |
8 475 792 |
3 990 |
18 009 664 |
7,91 |
299,3 |
|
01.01.2025 |
1 499 916 |
5 673 720 |
3 969 |
19 194 852 |
8,47 |
303,7 |
The pre-2008 crisis period saw a dramatic surge in RML issuance volume, soaring from RUB 30.9 billion to RUB 438.1 billion — an increase of 481 % over two years (equivalent to 144 % annualized growth).
Post-crisis market stimulus drove recovery in 2009. However, 2010 witnessed a sharp contraction:
— Loan count fell to 128,004
— Issuance volume dropped to RUB 142.97 billion ( representing declines of 61 % and 75 % respectively from peak levels ).
Demand gradually recovered through 2013 amid improving credit accessibility. Despite sanctions imposed in 2014, loan volumes continued expanding, with the exception of 2016 — when both metrics declined by over 30 %. Subsequent contractions occurred in:
— 2020 (loan count: -11 %, volume: -3 %)
— 2023 (loan count: -30 %, volume: -15 %)
Table 1
Drivers of Declines
|
Year |
Primary Driver |
|
2016 |
Reduced purchasing power (economic crisis) |
|
2020 |
Pandemic-induced disruptions |
|
2023 |
Key rate hikes (analyzed later) |
Thus, while the 2008, 2014, and 2020 crises triggered short-term contractions, these downturns were consistently mitigated through regulatory stimulus measures.
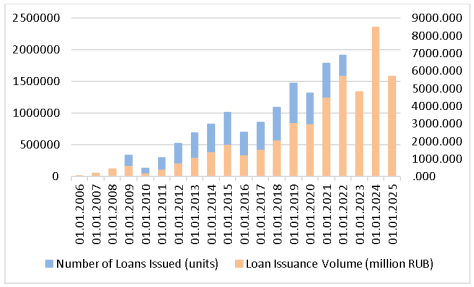
Fig. 5. Number and Volume of Loans Issued [23]
Prior to the 2008 crisis, outstanding mortgage debt grew dramatically, surging by 552 % in 2007 and 208 % in 2008. A contraction occurred in 2010 due to tightened lending policies.
Subsequently, the average loan size increased steadily at ~10 % annually, peaking at 20 % (2022) and 22 % (2023). The only negative deviation (-4.4 %) occurred in 2016 as a consequence of economic sanctions.
Meanwhile, outstanding debt expanded substantially through 2015, growing 30–40 % yearly. Growth moderated to 13–15 % during 2016–2017 following reduced new loan issuance. From 2018 onward, debt increased ~20 % annually, reaching 30 % in 2024.
Key drivers:
— Inflation and rising real estate prices doubled the average loan size (from RUB 1.7 million to RUB 4.0 million).
— Over 14 years, loan sizes grew 2.1-fold, while outstanding debt ballooned 16.5-fold.
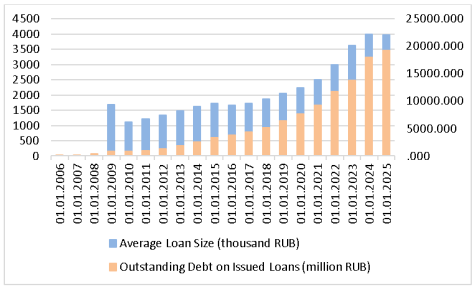
Fig. 6. Average Loan Size and Outstanding Debt [24]
Analysis of the weighted average interest rate reveals a general downward trend across the study period, with notable exceptions: increases of 9 % in 2013, 9 % in 2015, 6 % in 2022, and 19 % in 2024. The primary drivers of rate reduction were state stimulus measures and the introduction of preferential mortgage programs.
Concurrently, loan terms have progressively lengthened year-over-year. This trend correlates with three key factors:
- Rising average loan sizes
- Efforts to reduce monthly payments
- Increased availability of long-term preferential loans (up to 30 years)
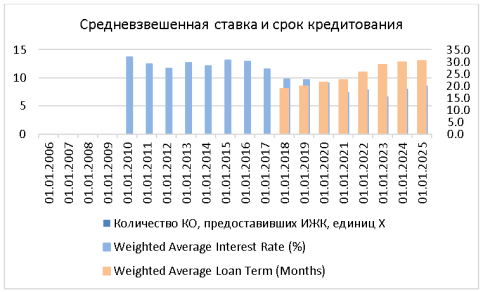
Fig. 7. Weighted Average Interest Rate and Loan Term [25]
Furthermore, examination of the Central Bank of Russia's (CBR) key rate throughout this period is essential, as analysis of residential mortgage loan (RML) issuance would be incomplete without it.
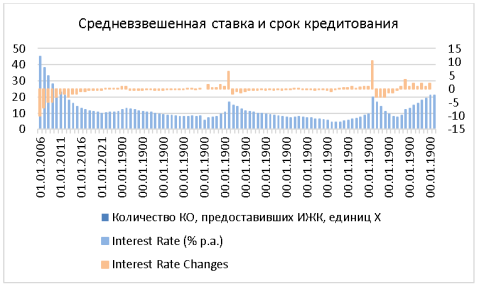
Fig. 8. Key Rate of the Central Bank of Russia (CBR) [26]
We will analyze this period through distinct temporal phases:
1. 2003–2008: Economic Stability & Growth
— Driven by high oil prices, GDP growth, and declining inflation.
— Accumulation of foreign exchange reserves and RUB appreciation.
— Key Rate Trajectory: CBR reduced rates from 45 % (2000) to 10 % (2008).
2. 2008–2010: Global Financial Crisis
— Oil price collapse (USD 140 → USD 40/barrel), capital flight, GDP contraction.
— Key Rate Response: Raised to 13 % (late 2008), then lowered to 7.75 % (2010) as stability returned.
3. 2010–2014: Modest Recovery
— Rebounding oil prices, moderate inflation, sluggish GDP growth.
— Key Rate Milestone: Reached a decade low of 5.5 % (2013).
4. 2014–2016: Sanctions & Currency Crisis
— Sanctions imposed, RUB depreciation, surging inflation.
— Emergency Action: Rate spiked from 10.5 % → 17 % (16 Dec 2014) — a historic high to halt RUB’s fall.
— Subsequent Adjustment: Gradual reduction to 10 % (2015–2016).
5. 2017–2020: Pre-Pandemic Moderation
— Steady economic growth; rate cut to 6.25 % (2019).
— Pandemic Response: Lowered to historic low of 4.25 % (2020) for economic support.
6. 2022–Present: Inflation Surge & New Sanctions
— Inflation peak (17.8 % — Apr 2022), RUB collapse (120 RUB/USD).
— Key Rate Actions:
- 20 % (28 Feb 2022) — Highest since 2013.
- Rapid cuts to 7.5 % (within 5 months).
- New hiking cycle: 8.5 % (Jul 2023) → 18 % (Jul 2024) → 21 % (current, Oct 2024).
Next Analysis Phase: Real estate price dynamics per square meter (primary/secondary markets).
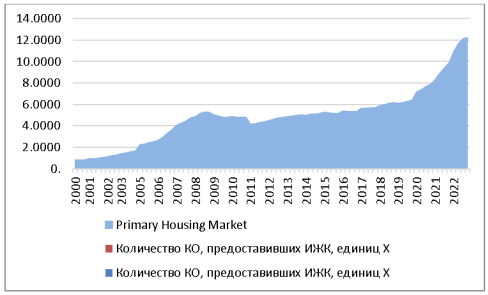
Fig. 9. Average Price per Square Meter of Total Floor Area for Apartments on the Primary Housing Market (RUB) [27]
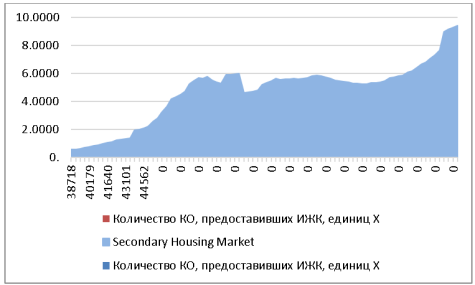
Fig. 10. Average Price per Square Meter of Total Floor Area for Apartments on the Secondary Housing Market (RUB) [28]
Examining the pre-2008 period reveals sustained real estate appreciation beginning in 2000, with peak quarterly surges occurring in:
— Q1 2001 (9.6 %)
— 2003 (13.8 %)
— 2005 (37.5 %)
— 2007 (13 %)
— 2006 (two quarters averaging ~12 % each)
Intervening periods saw moderate growth of 4–7 %. The secondary market experienced even steeper spikes, exceeding 40 % in Q1 2005.
Table 3
Aggregate Trends (2000–2008)
|
Market |
Avg. Annual Growth |
Price Evolution (RUB/m²) |
|
Primary |
7.6 % |
8,100 → 48,729 |
|
Secondary |
8.9 % |
6,000 → 52,266 |
Prices consistently appreciated irrespective of USD/RUB fluctuations during this phase.
Post-Crisis Volatility (2008–2015):
The 2008 financial crisis triggered prolonged instability. Maximum annual declines reached:
— Primary: -13.7 % (2011)
— Secondary: -23.07 % (2011)
Despite marginal average growth (0.36 % primary, 0.93 % secondary), 2015 prices settled at:
— Primary: RUB 52,602/m²
— Secondary: RUB 58,707/m²
Recent Dynamics (2015–2024):
— Secondary market: Declined through 2018, rebounding weakly in 2019 (+~3 % avg.)
— Primary market: Fell until 2017, then grew steadily (+~4 % avg.)
— By Q2 2024, prices reached:
— Secondary: RUB 110,151/m²
— Primary: RUB 171,166/m²
This surge was largely fueled by state-subsidized preferential mortgage programs.
Post-July 2024 Program Restructuring:
Following the discontinuation of broad state-backed mortgages (1 July 2024), only targeted programs remain:
- Occupation-Based:
— Medical Professionals, Teachers & Civil Servants
— Military Mortgage
— IT Sector Mortgage
- Family Status:
— Family Mortgage (for households with children)
- Geographic:
— Rural Mortgage
— Far Eastern Mortgage
- Eco-Certified Housing:
— «Green Mortgage» for energy-efficient properties
However, significant changes have occurred here as well: effective July 1st, the previous terms of the Family Mortgage program expired. While extended, the revised program now imposes strict geographic limitations: families with two or more children aged 7+ qualify only for properties in:
— Small towns
— Regions with low construction volumes
— Areas under targeted development initiatives
Risk Comparison:
Targeted Preferential Mortgages. Program compliance risks (e.g., interest rate hikes or subsidy clawbacks if conditions violated)
Subsidized Mortgages. Additional systemic risks:
— Market overheating from artificial demand → price inflation
— Affordability illusion (6–8 % rates) despite significant interest overpayment amid rising prices
— Heightened default risk due to relaxed borrower criteria
— Opportunity cost: RUB 500 billion (2023 subsidies) diverted from infrastructure/healthcare/education
— Market distortion: Primary market focus stunts secondary market development
Recommendations:
For Borrowers:
— Rigorously assess debt-to-income ratio (max 30–40 % of income)
— Model scenarios for eligibility loss (e.g., job change in IT-sector programs)
For Regulators:
— Tighten lending criteria (minimum tenure, income verification)
— Phase out blanket subsidies → transition to targeted programs
— Implement construction quality controls and price monitoring
Conclusion:
While subsidized mortgages address social objectives (housing accessibility), they introduce macroprudential risks evidenced by:
— Artificial real estate inflation (+71 % primary market premium by Q2 2024)
— Unsustainable household debt growth (16.5x since 2008)
— Policy Imperative: Balance social support with stringent oversight of:
- Credit volumes
- Price stability
- Construction standards
Without structural reforms, current models risk replicating international housing crisis patterns.
References:
- Strategy for the Development of the Construction Industry and Housing and Communal Services until 2030 with a Forecast until 2035. Presentation of 2022 Results on Russia's Construction Sector Activities and Regulatory Framework, p. 6.
- Kameneckiy, M.I. (2012). Assessment of Construction Complex Development Forecast Scenarios: 2020, 2030. Proceedings of the Institute of Economic Forecasting, Russian Academy of Sciences. Moscow: MAKS Press.
- Construction in Russia. 2002: Statistical Digest. Moscow: Federal State Statistics Service (Rosstat), 2002.
- Construction in Russia. 2004: Statistical Digest. Moscow: Federal State Statistics Service (Rosstat), 2004.
- Construction in Russia. 2006: Statistical Digest. Moscow: Federal State Statistics Service (Rosstat), 2006.
- Construction in Russia. 2008: Statistical Digest. Moscow: Federal State Statistics Service (Rosstat), 2008.
- Construction in Russia. 2010: Statistical Digest. Moscow: Federal State Statistics Service (Rosstat), 2010.
- Construction in Russia. 2012: Statistical Digest. Moscow: Federal State Statistics Service (Rosstat), 2012.
- Construction in Russia. 2014: Statistical Digest. Moscow: Federal State Statistics Service (Rosstat), 2014.
- Construction in Russia. 2016: Statistical Digest. Moscow: Federal State Statistics Service (Rosstat), 2016.
- Construction in Russia. 2018: Statistical Digest. Moscow: Federal State Statistics Service (Rosstat), 2018.
- Construction in Russia. 2020: Statistical Digest. Moscow: Federal State Statistics Service (Rosstat), 2020.
- Information Bulletin: Residential Mortgage Lending Market Data in Russia. Moscow, 2024. Central Bank of Russia (CBR). [Online] Available at: cbr.ru
- Review of the Residential Mortgage Lending Market. Central Bank of Russia (CBR). [Online] Available at: cbr.ru
- Number and Volume of Loans Issued. Central Bank of Russia (CBR). [Online] Available at: https://cbr.ru/statistics/bank_sector/sors/
- Average Loan Size and Outstanding Debt. Central Bank of Russia (CBR). [Online] Available at: https://cbr.ru/statistics/bank_sector/sors/
- Key Rate of the Central Bank of Russia. Central Bank of Russia (CBR). [Online] Available at: https://cbr.ru/hd_base/KeyRate/
- Review of the Residential Mortgage Lending Market, CBR [Online] Available at: www.cbr.ru
- Kameneckiy, M.I. (2012). Assessment of Construction Complex Development Forecast Scenarios: 2020, 2030. Scientific Proceedings of the Institute of Economic Forecasting, Russian Academy of Sciences. Moscow: MAKS Press
- Average Monthly Nominal Accrued Wages of Employees Across All Organizations, Rosstat [Online] Available at: rosstat.gov.ru
- Average Monthly Accrued Wages of Hired Workers in Organizations, for Individual Entrepreneurs, and Private Households, Rosstat [Online] Available at: rosstat.gov.ru
- Real Average Monthly Accrued Wages, Rosstat [Online] Available at: www.rosstat.gov.ru
- Number and Volume of Loans Issued, Central Bank of Russia (CBR) [Online] Available at: https://cbr.ru/statistics/bank_sector/sors/
- Average Loan Size and Outstanding Debt, Central Bank of Russia (CBR) [Online] Available at: https://cbr.ru/statistics/bank_sector/sors/
- Interest Rates on Ruble-Denominated Credit and Deposit Operations of Credit Institutions, Central Bank of Russia (CBR) [Online] Available at: www.cbr.ru
- Key Rate of the Central Bank of Russia (CBR) [Online] Available at: https://cbr.ru/hd_base/KeyRate/
- Average Price per Square Meter of Total Floor Area for Apartments on the Primary Housing Market, Rosstat [Online] Available at: https://77.rosstat.gov.ru/
- Average Price per Square Meter of Total Floor Area for Apartments on the Secondary Housing Market, Rosstat [Online] Available at: https://77.rosstat.gov.ru/

