The change in the technical condition of motor vehicles over time or under varying usage intensity can be assessed through variations in technical parameters such as stress, fuel consumption, wear and clearances, noise, productivity, and accuracy. Among these, surface wear at the contact points of moving friction pairs is the primary cause of the deterioration in technical parameters. Predicting the remaining service life essentially involves forecasting the wear condition of certain friction pairs such as the piston-cylinder assembly, main journal bearings, connecting rod bearings, piston rings, and clutch friction discs in motor vehicles. This paper focuses on predicting the remaining service life of these friction pairs based on the linear extrapolation method and the power function extrapolation method.
Keywords : vehicles, remaining service life, prediction, linear extrapolation, power function extrapolation, friction pair, wear.
1. Introduction
Typically, the cylinder experiences the most wear in the area corresponding to the top dead center (TDC) of the piston. This is due to high temperatures, high pressure, and the change in the direction of piston movement in that region. The area near the bottom dead center (BDC) of the piston also undergoes significant wear for the same reason-the change in the piston’s movement direction. The region between these two areas tends to exhibit moderate wear.
In absolute terms, the wear on the cylinder wall can reach 0.3–0.4 mm, while the wear on the piston ring can be as much as 0.6–0.8 mm. As a result, the piston ring end gap may increase to 1.2 mm or even more. The wear of the cylinder–piston group reduces the sealing of the combustion chamber, leading to decreased compression-end pressure and reduced mean effective pressure. Consequently, the combustion conditions worsen, and the engine may eventually become unable to start.
Wear of the crankshaft bearings leads to increased clearances and higher oil consumption through these gaps. Up to a certain limit-when the capacity of the oil pump is not yet fully utilized (i.e., the pressure-regulating valve remains open)-the increased clearance due to wear has little impact on the reliability of the bearings, as more lubricating oil continues to circulate through them.
The components with the shortest lifespan in the power transmission system of motor vehicles are the friction discs of the main clutch. Dry friction generated when the clutch discs and planetary steering mechanism discs slip against each other produces a significant amount of heat. This heat can be quantified by the sliding work of the main clutch, which can reach up to 10,000 kg·m during vehicle startup, with the surface temperature of the friction discs reaching 350–400°C. This is one of the main causes of friction disc wear.
Surveys show that under normal operating conditions, the average wear of a single friction disc is approximately 0.175 mm over its entire service life up to medium-level repair. The total wear of a complete set of main clutch friction discs can reach 3–3.5 mm. Due to wear, the clearance in the clutch disengagement mechanism decreases, requiring multiple adjustments during operation to restore the correct gap.
However, deviations from the average wear value are observed. Approximately 20–25 % of the main clutch friction discs exhibit wear greater than 0.25 mm. The mutual interaction between the friction discs causes microstructural deformation of the disc surfaces, increases contact pressure, accelerates the wear rate, and results in overheating of the friction discs.
2. Method for Predicting Remaining Service Life
Due to the random nature of the wear process, prediction results also have a probabilistic character. In general, the problem of prediction is mathematically complex. However, there are technical methods that can be applied to meet practical requirements.
The input data for the remaining service life prediction includes the current technical condition of the component at the time of assessment (i.e., the moment of diagnostic inspection), the nature of the damage, and the limiting condition-beyond which the component is considered functionally ineffective and must be either replaced or restored through repair.
Moreover, prediction is only possible when the progression of technical condition changes over time can be extrapolated. Therefore, the more accurately the current technical state of the product is known, the more reliable the prediction results will be.
2.1. Linear Extrapolation Method
If the break-in period and the accelerated wear phase are disregarded, the wear process can be considered linear. In this case, a simplified wear characteristic curve, as shown in Figure 1, is obtained.
Due to the diversity of factors contributing to wear, the wear process is dispersed. However, in reality, it is impossible for any wear progression to coincide exactly with either axis of the coordinate system. The remaining service life is calculated from the latest inspection time (denoted as h) to the point when the component reaches its limiting condition. Since the moment at which the limiting condition is reached is random, the remaining service life is also a random variable.
The expected value (mean) of the remaining service life is:

where


And also, we have:

Or

In the case of prediction based on a single diagnostic inspection, the remaining service life is calculated using the following formula:

Where: t 1 — Time of inspection (first inspection); h 1 — Average wear depth at the time of inspection. At the time of inspection, the wear depth is scattered within a range of:

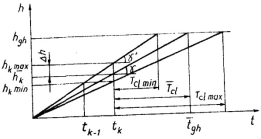
Fig. 1. Linear model for predicting remaining service life
The remaining service life, therefore, lies within the range:

Or

When the wear depth at the time of inspection follows a known probability distribution, the γ % remaining service life can be calculated.
2.2. Power Function Extrapolation Method
A power function can be used to predict the remaining service life of a friction pair.

Where: h0 is a wear characteristic that accounts for the component's operating time;
α is the power exponent, determined based on data obtained from diagnostic inspections;
Z is the wear depth error — a random variable.
Let us consider a simple case in which the wear curve is smooth, continuous, and either convex or concave; in other words, it can be described by a basic power function with Z=0.
Let the time from the current moment to the point when the friction pair reaches its limiting condition be the remaining service life, denoted as T cl . Then, we have:

When the wear depth h(t) at the current time (inspection time) is known, the value of h0 can be determined using.

After substituting the value h 0 we obtain:

In particular, when α=1, corresponding to the linear extrapolation case.
Now, let us consider a more common case — when there exists a diagnostic error Z. In this case, the wear process is represented by a piecewise curve, as shown in Figure 2.
The solid lines represent the actual wear process within the diagnostic intervals tk. The dashed lines represent the extrapolated functions for those intervals, using parameters h0 and α.
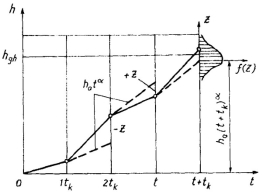
Fig. 2. Representation of the wear process with diagnostic error
When diagnosing a friction pair after 2,500 hours of operation, the clearance was found to be 0.4 mm. The limiting clearance is known to be 0.7 mm. Based on experimental studies, the wear process has a power exponent 1.3, and the standard deviation of the diagnostic error is ν* = 0,3. Determine: The mean remaining service life, and The 95 % remaining service life of the friction pair.
Mean Remaining Service Life:

To determine the 95 % remaining service life, the following formula is applied using: φ(x)=0,95, x=1,64.

The above result means that 50 % of the examined friction pairs will fail after approximately 1307.5 hours, while 5 % will fail after only about 664 hours of further operation.
3. Conclusion.
This paper focuses on analyzing the factors influencing the wear of friction pairs in motor vehicles during operation. Based on that, it aims to predict the remaining service life of these friction pairs, with particular emphasis on those in the engine and the main clutch of motor vehicles.Using linear extrapolation and power function extrapolation methods, the author has calculated the remaining service life of a typical friction pair found in motor vehicles. These methods provide a foundation for predicting the remaining service life of other mechanisms and assemblies in the vehicle.
References:
- Tran Tuan Diep. Textbook of Probability Theory and Mathematical Statistics. Publishing House for Universities and Vocational Schools, Hanoi, 1977.
- Nguyen Trong Hiep. Fatigue Strength Assessment of Machine Elements Based on the Differential Equation of Fatigue Failure . Proceedings of the 3rd National Mechanics Conference, Vietnam Academy of Science, Hanoi, 1983, pp. 90–95.
- Do Duc Tuan. Reliability Determination and Technical Condition Diagnosis of Diesel Locomotives. Science and Technology Information, University of Railway and Road Transport, No. 3/1982, pp. 72–82.
- Phan Van Khoi. Fundamentals of Reliability Assessment. Science and Technology Publishing House, Hanoi, 2000.
- Nguyen Hoang Nam. Vehicle Operation Fundamentals, Volume 1 . People's Army Publishing House, Hanoi, 2003.
- Trukhanov V. M. Reliability in Engineering . Moscow: Mashinostroenie, 1999. 598 pages.
- Mikhlin V. M. Prediction of the Technical Condition of Machines . Moscow: Kolos, 1976. 288 pages.
- Birger A. I. Technical Diagnostics. Moscow: Mashinostroenie, 1978. 239 pages.

